Market advantage with ground-truth data
Real-time analytics on Thai sugarcane season
Track harvest progress, sugar content and cane prices, and compare this season with past ones.
Harvest pace
Illustrative dataPace index
104
+4.0% vs 5-season avg
Average CCS
11.9
+0.2 vs last season
Crush day
96
season in progress
Check market estimates against ground truth
CaneHarvest measures what the market usually has to estimate, and compares it with past seasons.
How this season compares with past seasons.
Season size against past seasons
Illustrative dataHow much sugar the cane contains, measured in mill laboratories as CCS.
Sugar content (CCS) by week
Illustrative dataHow much contracted cane is still in the field, compared with the same day last season.
Cane left to harvest
Illustrative dataThe initial and final cane price for each season.
Cane prices by season
Illustrative dataHow much growers have been paid for the cane they delivered.
Grower payments
Illustrative dataCharts on this site use illustrative data, not live figures.
Ground truth from the mills
Most views of the Thai crop are estimates. CaneHarvest is built from the records mills keep as cane is delivered.
Opinion
Analyst reports
Judgement from models and field visits, revised during the season.
Remote sensing
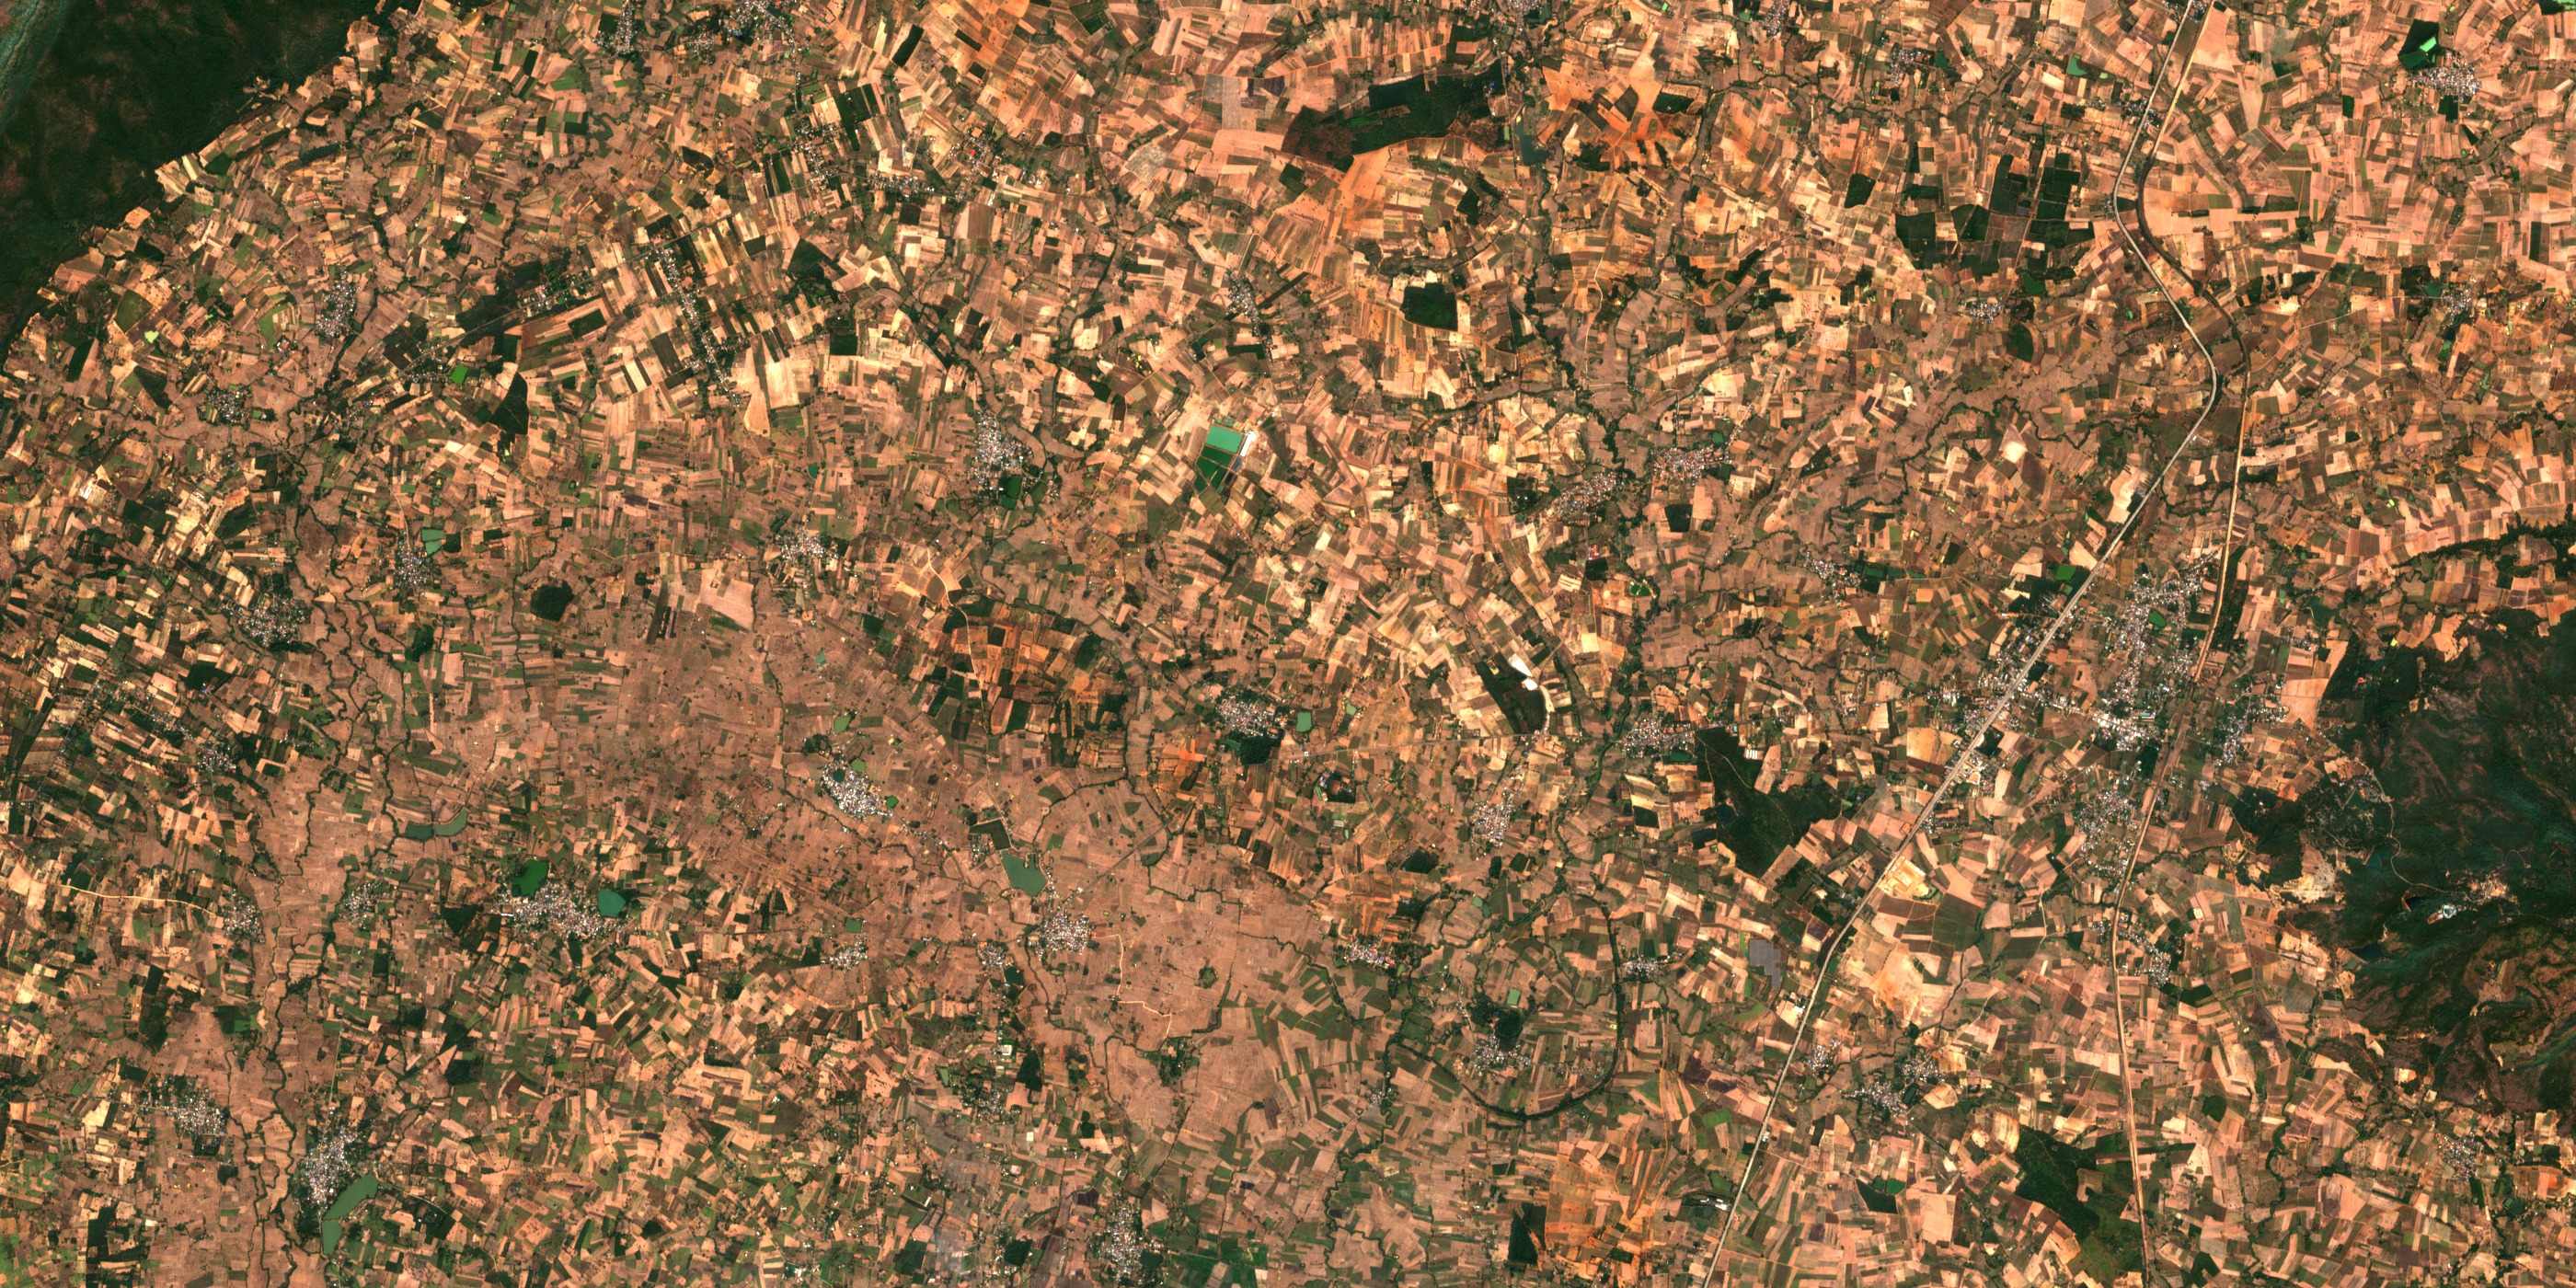
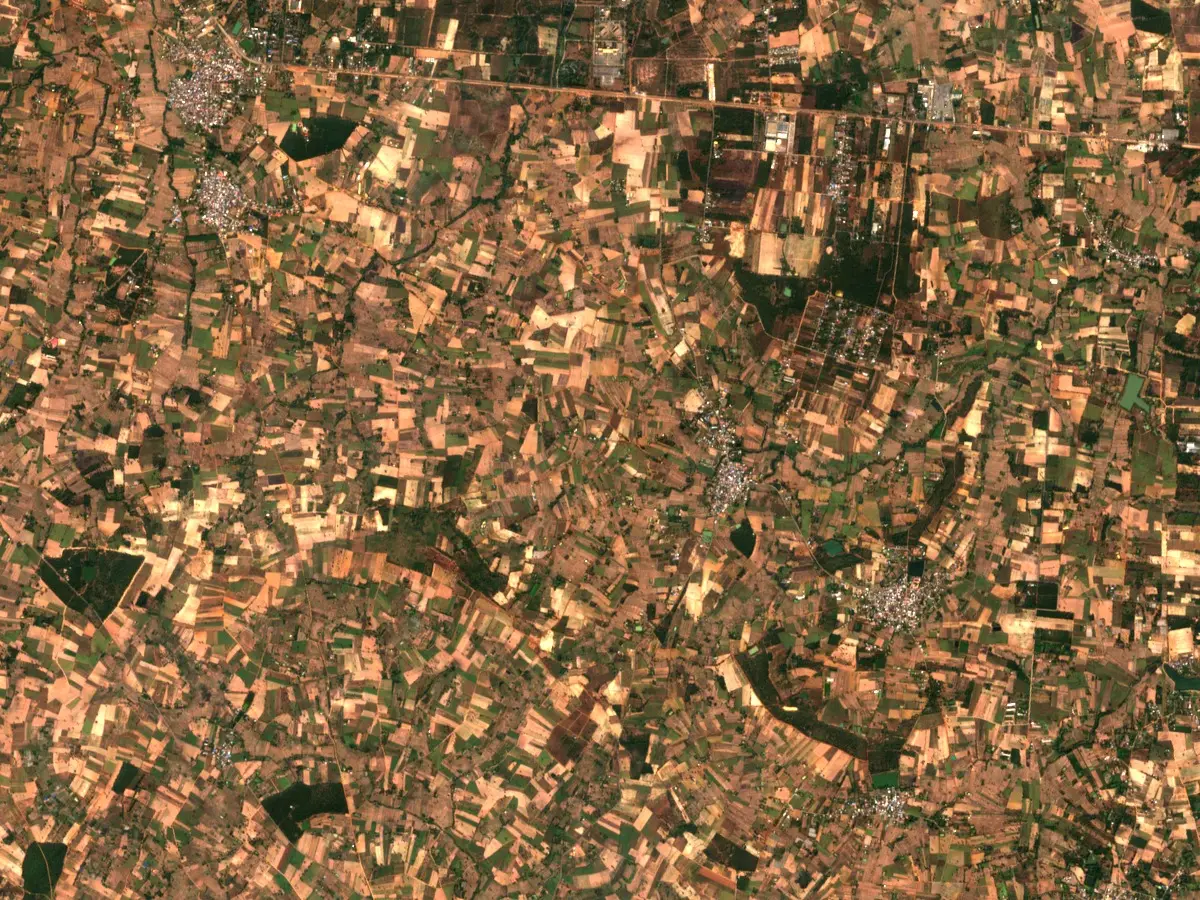
Satellite data
Images of fields, converted into crop estimates by a model.
Ground truth
CaneHarvest
Mill records of cane weighed on delivery and tested for sugar, updated as mills report.
Measured at the mill
Each load of cane is weighed when it arrives, and its sugar content is tested in the mill laboratory.
Comparable across seasons
Every season uses the same definitions, so you can compare any season with another.
Who uses CaneHarvest
Sugar trading desks
Physical and futures traders with Thai sugar exposure.
- Uses it to
- Track harvest pace and sugar content during the season.
- Key data
- Harvest progressSugar contentSeason size
Banks and lenders
Credit and trade finance teams lending to Thai mills, growers or sugar traders.
- Uses it to
- Monitor deliveries, cane prices and grower payments to assess credit risk.
- Key data
- Grower paymentsCane pricesSeason size
Research and analysts
Analysts and economists covering Thai sugar at banks, funds and consultancies.
- Uses it to
- Build and test supply models on measured season data.
- Key data
- Season sizeHarvest progressSugar content
Refiners and sugar buyers
Procurement teams at refiners and food companies buying Thai sugar.
- Uses it to
- Follow Thai supply during the season to plan purchases.
- Key data
- Harvest progressSugar contentCane prices
Frequently asked questions
For anything else, email sales@caneharvest.com.
Where does the data come from?
From the records Thai sugar mills keep when cane is delivered: the weight of each load and its sugar content from the mill laboratory.
How is this different from official figures?
Official figures come out on the authorities' own schedule, mostly in Thai. CaneHarvest updates through the season and keeps past seasons on the same definitions, with harvest progress, cane prices and grower payments in one place.
Can we check what's covered before we license?
Yes. Before you commit, we share what is covered, how it is measured and how each figure is defined.
How is it licensed and priced?
Annual licences for an organisation, based on what your team needs. Pricing is on request.
Can we share the data outside our firm?
A licence covers your organisation's own use. Ask us if you need more.
Get access to CaneHarvest
Tell us about your team and what you need. We'll reply with what's covered and how licensing works.